June 2020
Caught in the slipstream, or powering ahead? Dr Rebecca Harding examines ASEAN’s trade momentum in the context of wider geopolitical disruption
While the US and China have agreed not to escalate the trade war in a ‘phase one’ deal signed in January 2020,1 tariffs on each other’s goods remain in place. But to what extent are the Association of Southeast Asian Nations (ASEAN) countries caught up in the trade war crossfire?
Tariffs imposed on China by the US have undoubtedly affected the bilateral relationship between the two countries. The UN estimates that in the first half of 2019, US tariffs caused a 25% drop in exports from China to the US – an equivalent value of around US$35bn to the Chinese economy.2 Despite the recent de-escalation of tensions, China’s economy has slowed to its lowest side-level of growth in 26 years, with 2019 growth at a mere 6.1%.3
There are many reasons for this, but the material point for ASEAN countries is this: China is its second major export partner after the US, with a value worth more than US$280bn to the region. So how does China’s slowing growth on the one hand, and the impact of the trade war on the other, affect the region’s trade prospects? Are these effects purely negative, or will the reallocation of supply chains to avoid US tariffs actually accelerate a trend of intra-regional trade and boost the region’s economy?
Regional strength
3.4%
The region as a whole has a trade surplus and extra-regional exports to the rest of the world over the past five years have grown in value at an annualised rate of 3.4%, compared to imports, which have grown at 1.5%. Intra regional trade has grown at a rate of just 0.3%. This suggests that the region’s strength is as an extension to Chinese and South Korean supply chains in particular. (See Figure 1)
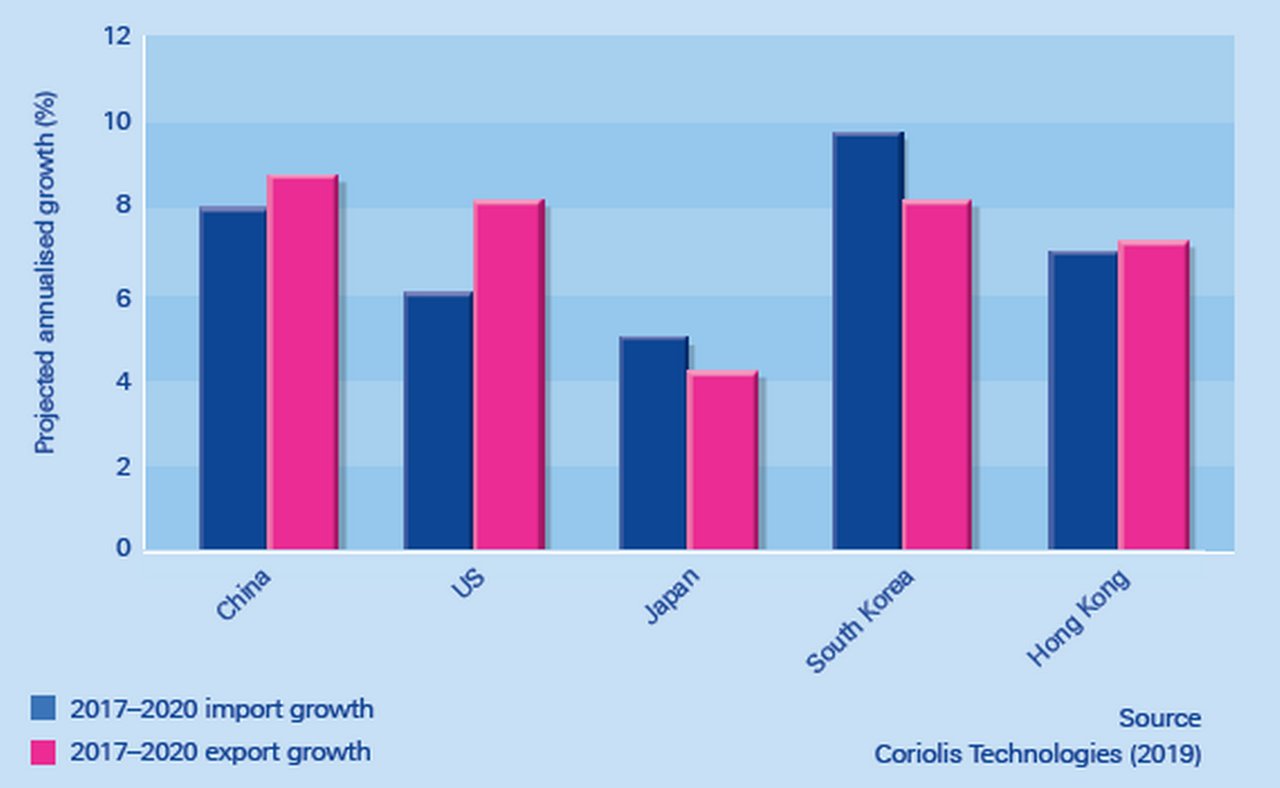
Figure 1 ranks each of the top five import partners of the region by size of country from left to right, so China is the largest and Hong Kong the smallest. Annualised growth over the past three years, since the onset of tensions between China and the US, has been substantial in import and export terms. Imports from China are projected to have grown at an annualised rate of 8% by the end of 2020 and exports back to China by nearly 9%. South Korean import growth over the past three years appears to be the largest at nearly 10%, while export growth is 8%.

Figure 1: ASEAN extra-regional trade to key partners, 2017 - 20 (projected annualised growth, %)
Source: Coriolis Technologies (2019)
"The most interesting sector with growth is a region called ‘Asia NIE’, or ‘Asia not indicated elsewhere"
The rate of growth in trade with China is significant, but the most interesting sector with regards to growth is a region called ‘Asia not indicated elsewhere’, or ‘Asia NIE’. This is the ASEAN region’s second largest import and fifth largest export partner, although it is excluded from the chart because it is a collection of countries that are too small, or do not report regularly. Asia NIE is therefore not included in the UN Comtrade trade data as a partner.
However, countries within Asia do trade with Asia NIE and, because Coriolis Technologies mirrors that data on the basis of the bilateral flow, we pick it up as a valid partner ‘country’. Since 2017, its trade with ASEAN has increased by 9.8% in import value terms and by 8.8% in export value terms. The top three sectors are electrical products and equipment, oil and gas, and machinery and components; all of which have had either tariffs or restrictions placed on them. It is a logical conclusion that trade is being diverted via this partner across the region to limit the impact of the trade war.
Intra-regional trade growth
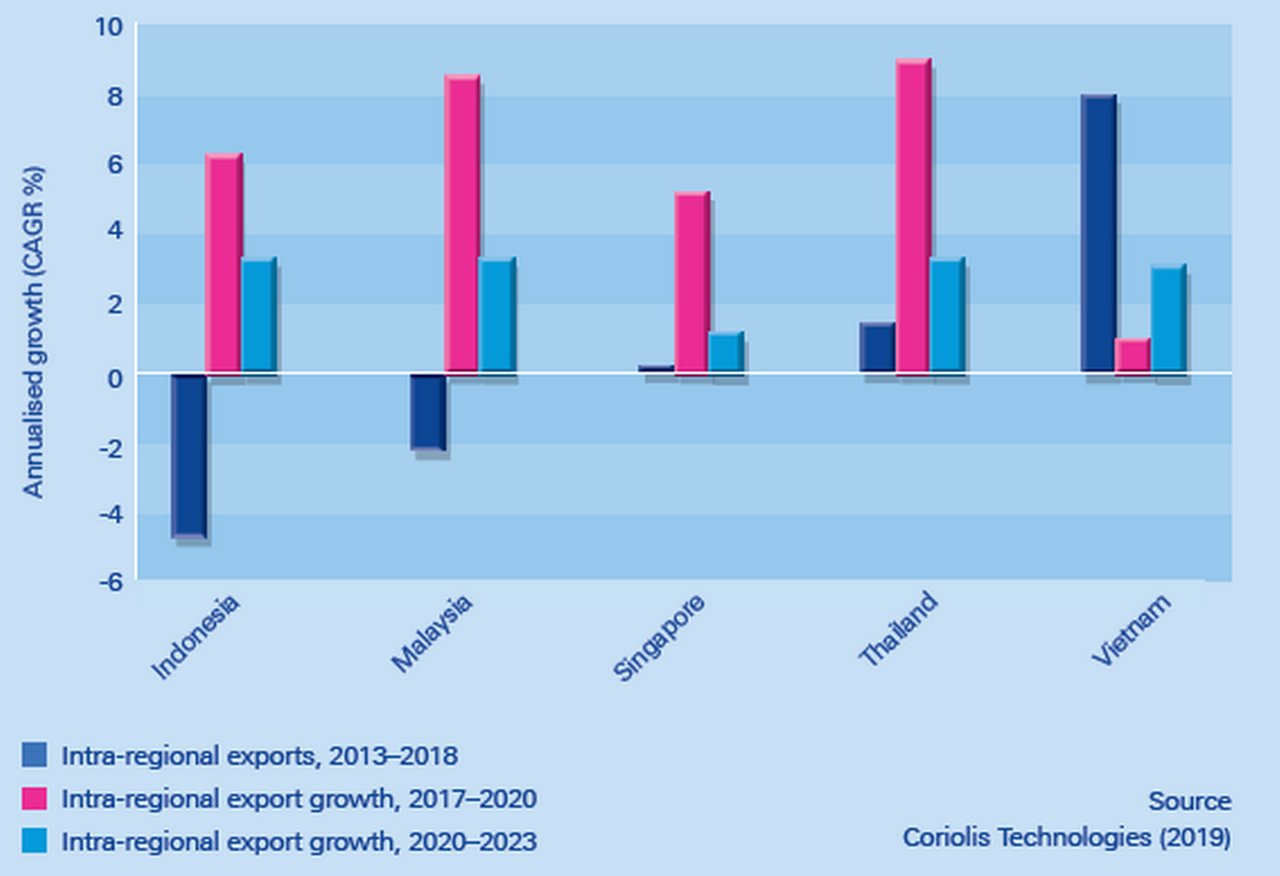
Intra-regional trade is projected to grow into 2020 over the same period from 2017 (see Figure 2). Figure 2 illustrates that not everything can be attributed to trade diversion as a result of the trade war. By the end of 2020, Singapore’s trade growth with ASEAN is set to increase by 5.2%, Malaysia’s by 8.6% and Thailand’s by 9.1%, for example. This is faster growth in the past three years than over the 2013−2018 period, when annualised growth was 0.2% for Singapore, and negative for Malaysia and Indonesia at -2.2% and -4.7% respectively. This is largely accounted for by the weakness in oil prices during that time. As a result, the more recent growth cannot be attributed to the trade war as such because it is, to a large extent, recovery from the collapse of oil and gas prices between 2014 and 2016.

Figure 2: ASEAN intra-regional trade growth for its top five intra-regional exporters, 2017 - 20 and 2020 - 23 (projected annualised growth, %)
Source: Coriolis Technologies (2019)
However, the three countries (Vietnam, Thailand and Singapore) where trade growth was positive between 2013 and 2018 tell us where the internal growth is coming from within the region. These are countries that are net oil importers, thus their trade growth is driven by goods produced rather than commodities and, as a result, they are less vulnerable to the oil price. Vietnam’s top export partners are China, Japan and South Korea, and over the five years to the end of 2018, annualised growth in trade to those countries was nearly 28%, 8.6% and 22% respectively. In other words, the pattern of shifting supply chains out of China − but also from Japan and South Korea as well − started in 2013, not 2017 when tensions with the US began.
Similarly, Thailand imports the most from Japan but growth slowed over the five years to 2018, while export growth was at an annualised rate of nearly 3%. Thailand’s imports from China grew at an annualised rate of 4% and its exports at 3%; again suggesting that there was a longer-term pattern of relocation of supply chains, as China became more expensive in terms of wages after the financial crisis.4
Onward trajectory
In summary, there are some noticeable effects in the ASEAN data that suggest some impact of the conflict between the US and China. For example, the region’s external and internal trade is increasing and trade is being pushed through partners like Asia NIE, which suggests a more direct attempt to relocate supply chains, for example, to countries that fall outside normal trade reporting protocols. The compliance risks of this are apparent – trade with Asia NIE is worth more than US$800bn in import and export terms, but runs the risk of being insufficiently transparent to comply with tighter sanctions and tariff rules.
However, much of the growth in Singapore, Malaysia or Indonesia’s intra-regional trade is equally attributable to the aftermath of the collapse in oil prices and a small catch-up effect with Vietnam and Thailand, where the effects of supply chain reallocation have been evident for a while. ASEAN as a region is fuelling its own growth, but taking advantage of any positive fallout from the US−China trade war.
Dr Rebecca Harding is CEO of Coriolis Technologies
This article was completed in January 2020 as a review of overall ASEAN trends before the full impact of Covid-19 became clear. While the historical data to 2019 remains accurate, the 2020 projection element of the data is subject to downward revision. A full picture of how Covid-19 has impacted global trade will be published in the H2 2020 issue of flow

Sources
1 See https://bbc.in/3bSXFRP at bbc.co.uk
2 See https://bit.ly/2SNKgTy at unctad.org
3 See https://on.wsj.com/2vT4FNQ at wsj.com
4 Wages have grown from an average of CNY37,147 in 2010 to CNY82,461 in 2019, see tradingeconomics.com/china/wages. Annualised real wage growth was above 9% between 2008 and 2014, see https://bit.ly/32mUuxm at ilo.org
You might be interested in
Trade finance and lending
Farewell to trade barriers? Farewell to trade barriers?
At the close of an extraordinary year, eyes are on growth forecasts for 2021 as economies climb out of Covid-19. But for these to materialise, trade needs to move back towards multilateralism, explains Dr Rebecca Harding
Macro and markets, Cash management, flow case studies
The rise of Global Capability Centres in APAC The rise of Global Capability Centres in APAC
Formerly, it was mainly back-end functions that were outsourced to Asia-Pacific. Today, these hubs drive technological innovation and enhance organisational efficiency on a global scale. What does this mean, both for the treasury function and for corporate banking services?
Macro and markets, Trade finance, Cash management, Opinion {icon-book}
View from the top: A different level of athlete View from the top: A different level of athlete
Deutsche Bank’s David Lynne shares his perspective on how corporates are evolving their businesses and how this is reshaping bank/corporate relationships as they navigate new trade corridors, reroute supply chains and empower direct access consumers


