13 October 2022
As the world grapples with cost of living and energy security crises, inflation continues its relentless rise. Dr Rebecca Harding considers five questions around the links between inflation and trade, finding the answers in trade flow data
MINUTES min read
Inflationary pressures have been the economic story of 2022 and will continue to build into 2023.
Rising energy and food prices, accelerated by the Russia-Ukraine crisis1 have impacted the cost of living in developed economies and emerging ones alike2. However, inflation triggers had already been building since the Covid-19 pandemic – in 2021 the International Monetary Fund (IMF) had estimated the cost of fiscal support at US$16trn3. In addition, supply chain shortages and continuing anti-Covid lockdowns in China have contributed to the broader inflationary picture.4
Trade shows us a more detailed snapshot, both of how inflation has built in the immediate aftermath of the Ukraine conflict and in terms of a bigger structural shift in the global economy. To find out how, we should ask ourselves five key questions that help us understand the complexity of inflation. Trade is both a lead indicator and a conduit of global inflation and shows us where some of the limitations of orthodox macroeconomic policy are when addressing the issue.
1 How has trade performed since the pandemic?
The volumes of global trade, in other words, the physical amounts of goods that have gone around the world, recovered their pre-pandemic levels as early as July 2020 and had risen above those levels by the end of the year. Since then, however, the amount of trade has grown on average at 0.5% a month over a 24-month period. Compare this with the value of trade over the same period, and trade values have grown at an average of 15% a month (see Figure 1).
This dramatic figure includes a drop in values in early 2021 that resulted from supply chain shortages; it also includes a significant collapse in oil prices during the first part of the Covid pandemic. The figure illustrates clearly that most of the increase in values has been in 2022.
The obvious conclusion – it is the immediate impact of the Russia-Ukraine crisis that has triggered the rapid escalation in values and that this is now feeding into higher prices.
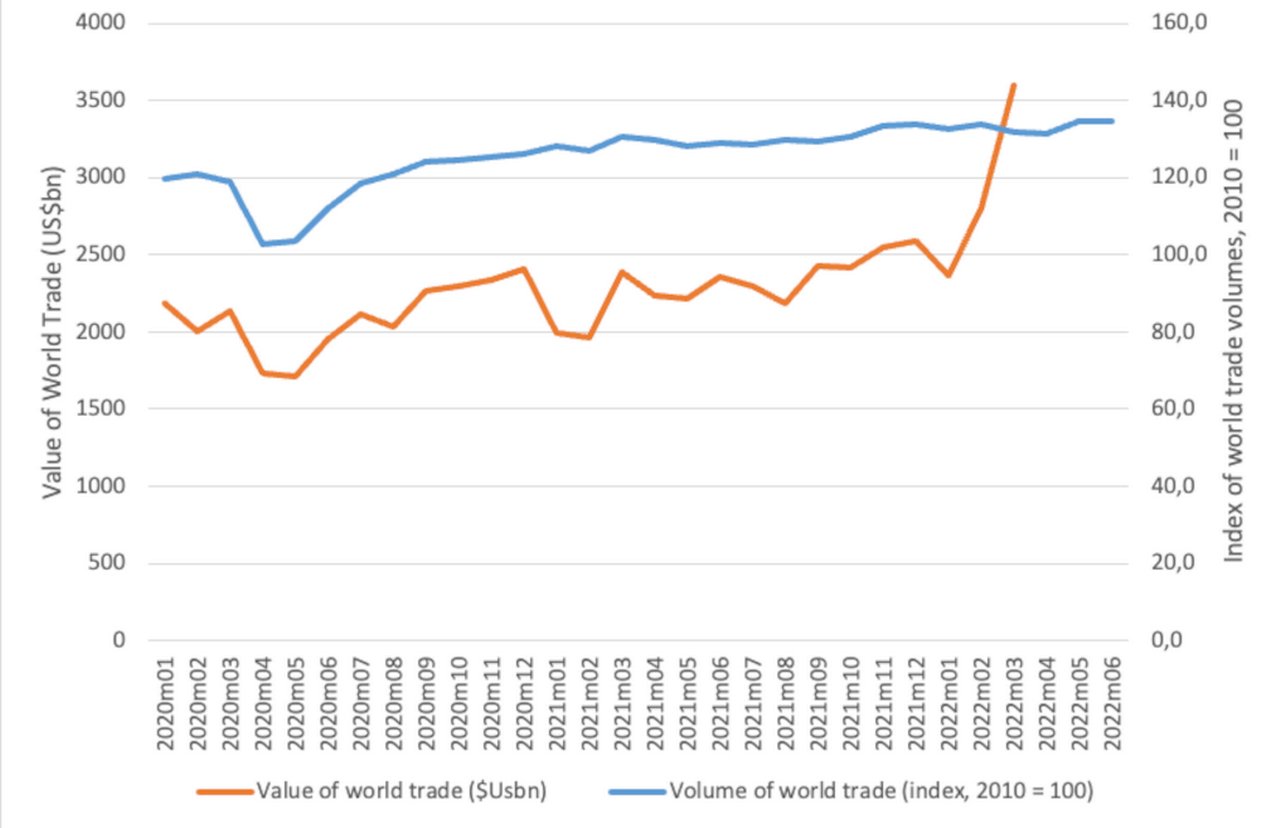
Figure 1: World trade value and volumes since January 2020, US$bn
Source: Coriolis Technologies, CPB Netherlands World Trade Monitor
2 Are some countries more affected than others?
If it is just the countries that are most directly exposed to the Russia-Ukraine crisis with the fastest growth in values, then this conclusion is valid.
However, it seems to be that China has seen the fastest growth in its prices in the wake of the Covid pandemic, and not those European countries more dependent on Russian oil and gas (see Figure 2). The data shows growth in import and export values of 50% and 49% respectively between February and March 2022 alone, but not shown in this graph is an increase in value growth of China’s trade between January and March 2022 of 145% for imports and 119% for exports. In other words, something was happening to the pandemic-driven values of Chinese trade even before the Russia/Ukraine crisis had impacted elsewhere.
There are other points of note from this country picture:
- Imports have been affected more than exports in value terms. The US import values went up the most, but this could be because of America’s reliance on Chinese imports which are worth some US$151bn annually compared to the whole of the EU which represents around US$134bn.
- Germany is particularly exposed to Russian oil and gas, but the increase in trade values was similar between February and March to that seen in the US and the UK.
- Russian imports dropped in value between February and March. This reflects a drop in trade into Russia as a result of the imposition of sanctions and embargoes at the beginning of the Ukraine conflict.
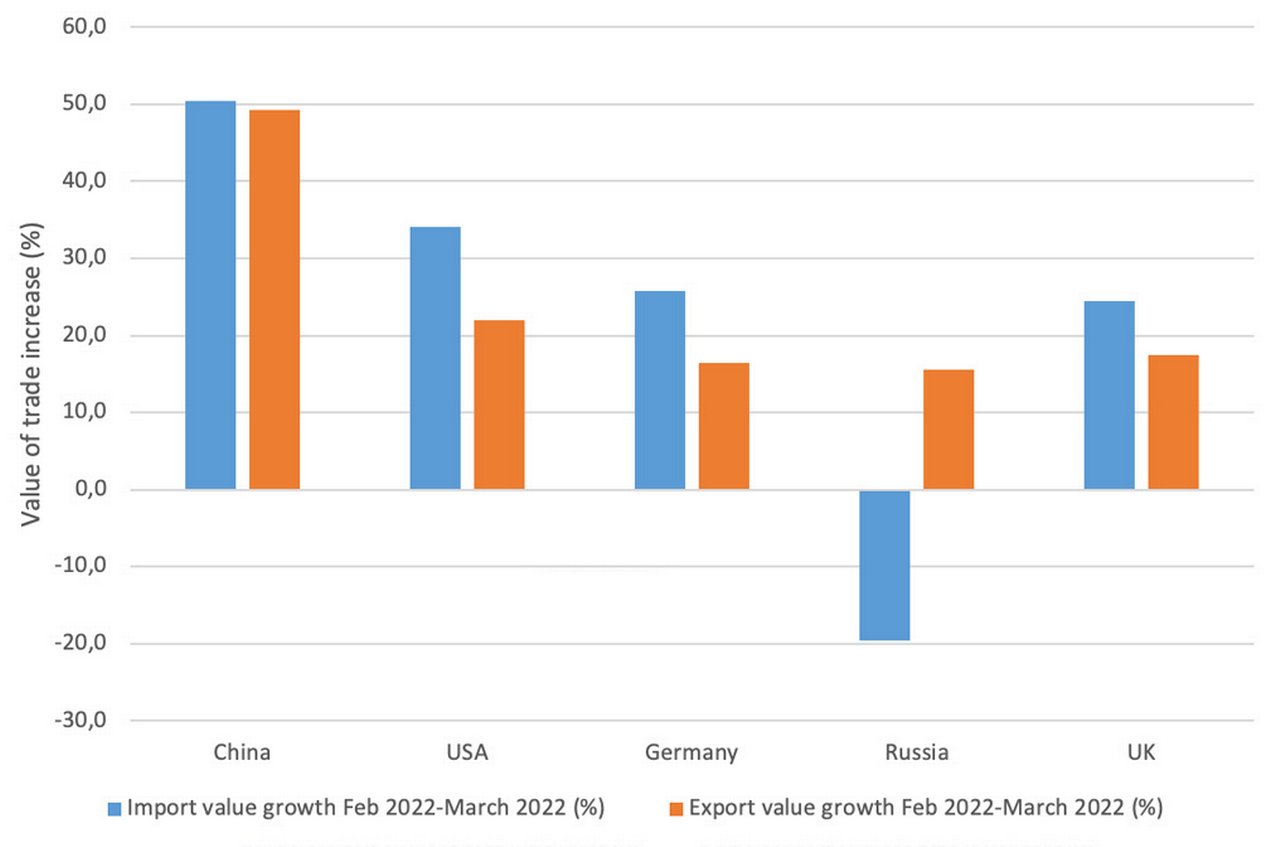
Figure 2: Value of trade increase between February 2022 and March 2022 for selected countries (%)
Source: Coriolis Technologies
This data suggests the impact of China’s lockdown is pushing up the value of its trade with the rest of the world and therefore, that it is over-simplistic to focus solely on the Russia-Ukraine crisis.
“It’s not possible to conclude that everything stems from one event”
3 Which sectors have seen the biggest increases in trade values over time?
The answer to this question reveals more about which supply chains are going to be most affected and whether energy and food are the primary sources of inflation. One should bear in mind here that the global jump in trade values between February 2022 and March 2022 was a huge 51%.
The biggest increases in values between February and March were in electronics (see Figure 3) while fossil fuel and machinery and components values climbed by around 30%. However, an increase in fossil fuel values has been evident since April 2021, while electronics and machinery prices have risen most recently. This suggests two conclusions:
- First, the immediate price increases seem to have come from specific commodity groups associated with electronics and machinery and computing as much as they have come from fossil fuel prices.
- Longer term, fossil fuel prices were increasing before the Russia-Ukraine crisis, and this is where some of the enduring long-term inflationary pressures have started to build.
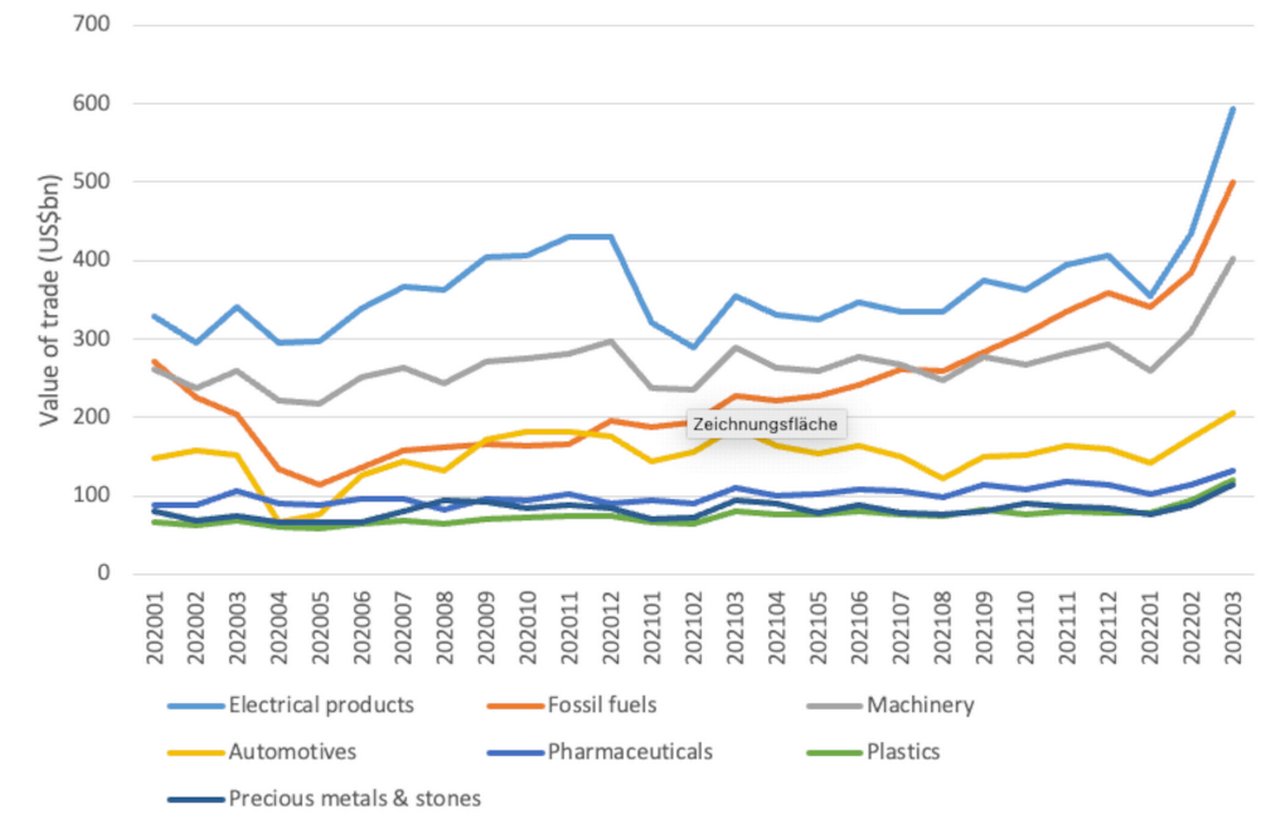
Figure 3: Trade value of world's top six largest export sectors since January 2020, US$bn
Source: Coriolis Technologies
Let’s dwell on the electronics and machinery and components aspects of the price increases for a moment. These are the sectors that include, respectively, semi-conductors and computers as well as household goods and engineering equipment. In other words, they are the sector groups that have been most prone to supply chain shortages.
A more detailed picture of the value increases between February and March 2022 tells us more about the structural changes happening in the global economy because the fastest growing value increases are in those sectors associated with the electronics supply chains (Figure 4).
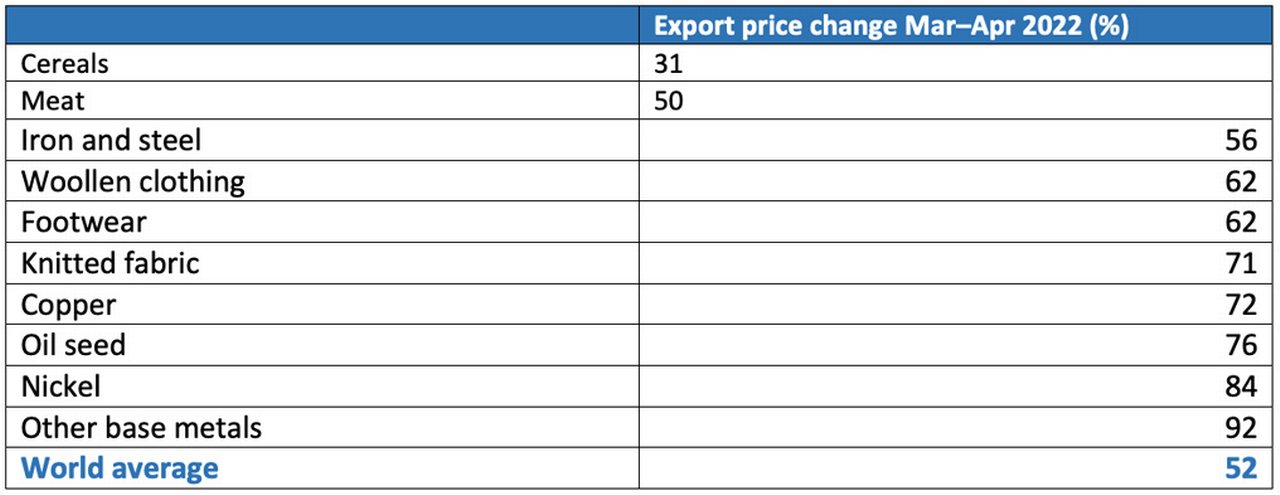
Figure 4: Export price increases February to March 2022 (%)
Source: Coriolis Technologies
Figure 4 can be divided into two groups: those that affect the way in which global economies operate, and those which affect consumers directly.
For example, base metals include cobalt, which is fundamental to the production of semi-conductors, as are nickel and copper. Iron and steel prices have risen by 56% as well – more than the global average increase in those two months. These metals are rising in price and are doing so because they are central to the digital economy and the transition to clean energy5 and the extra demands on their use as the global economic base shifts will increase6. Russia is a major producer, but so are China and African nations. The significantly higher increases in trade values in these products indicates longer term pressures as well as the immediate aftermath of the crisis.
Other price increases that affect our livelihoods as consumers include oil seed, clothing, footwear, meat and cereals. They give us a picture of where real hardship may result from price increases in the coming months.
4 Which countries and regions will be most affected by trade-based inflation?
Comparing the price increases between February and March 2022 shows that while inflationary pressures were clearly building everywhere, intra-regional trade was the most affected. This is particularly the case for trade between the African Continent Free Trade Area (AfCFTA) countries, but Asia Pacific and North America were also experiencing a significant impact.
Interestingly, the EU was less affected and this may be due to the type of trade within Europe, which is built around internal supply chains. This is corroborated by the fact that the EU’s import values from outside of the region increased the most – in other words, the internal market may have had some shielding effects at the beginning of the Russia-Ukraine crisis.
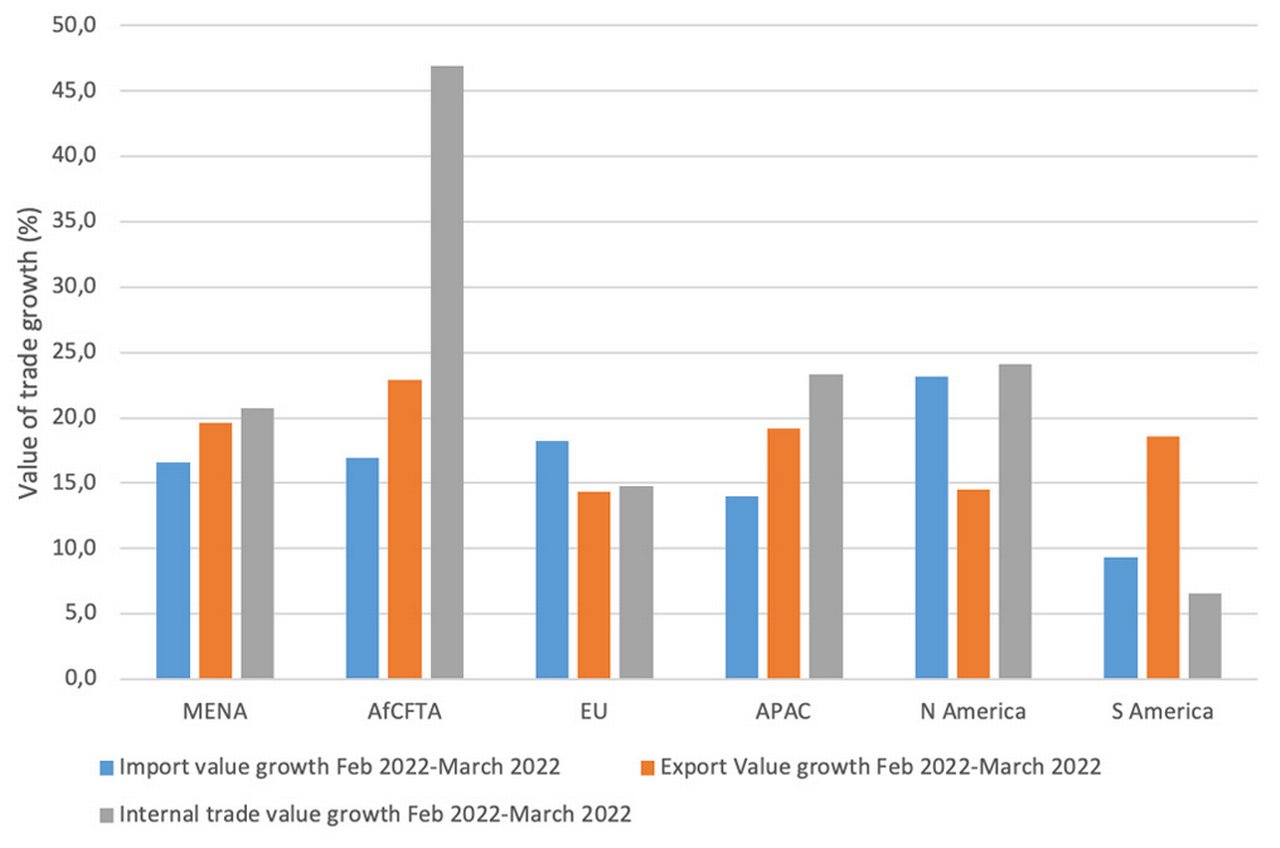
Figure 5: Value of trade increase February-March 2022 by region (%)
Source: Coriolis Technologies
Africa, however, presents a worrying picture for the rest of the world. It is highly dependent on fuel and grain imports from Ukraine and Russia, and its internal trade has not managed to grow quickly enough to cover the gap in supply. This has happened despite South Africa being a major grain producer and the whole region exports substantial quantities of fossil fuels (see Figure 6). While trade between the region as a whole and the outside world has grown in value terms, intra-regional trade has fallen.
The increase in trade values in the wake of the Russia-Ukraine conflict for internal and external trade is clear; and is impacting inflation – in Nigeria alone the rate has grown to around 20%. 7 The rise may be replicated across a region which is still struggling with the aftermath of Covid and experiencing recession for the first time in more than 25 years8.
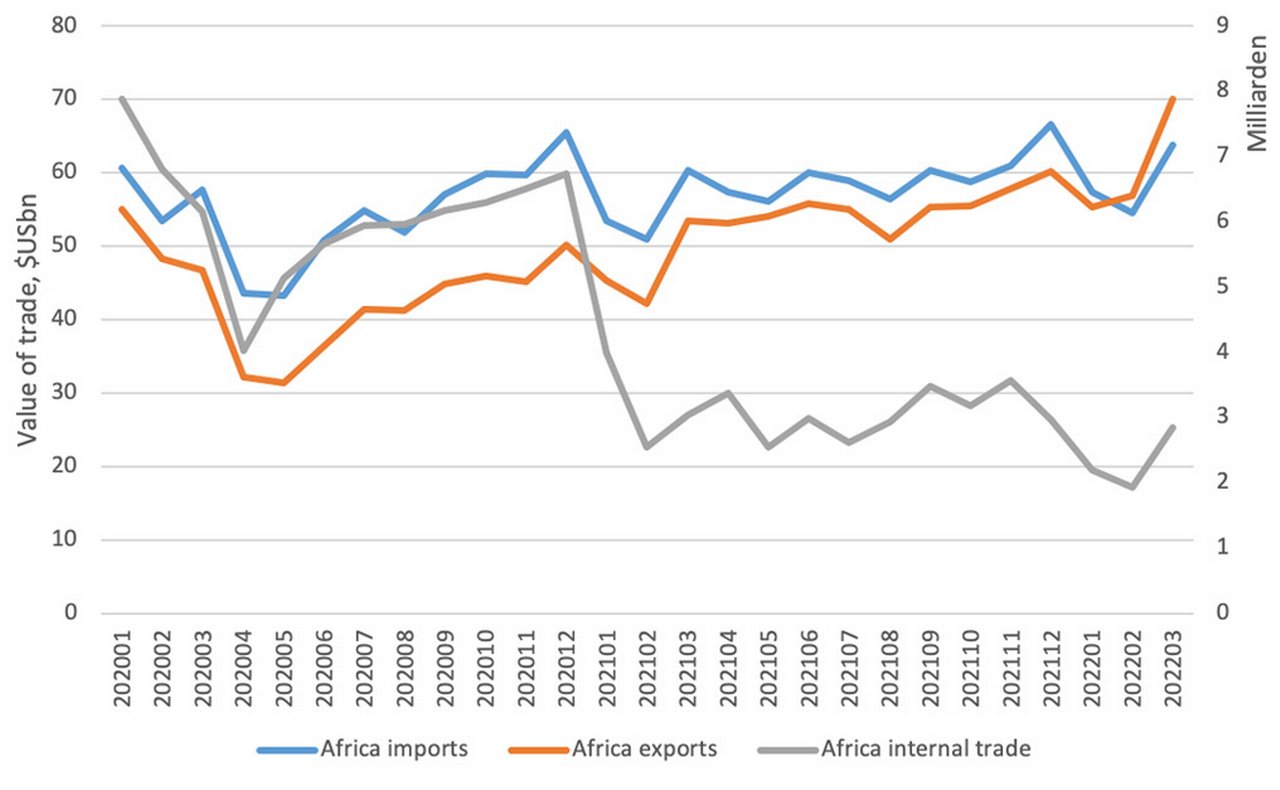
Figure 6: Value of African trade, January 2020-March 2022, US$bn
Source: Coriolis Technologies
5 What can be done?
All these recent trends suggest that the world trade system is acting as a conduit for global inflation not just because of the crisis in Ukraine, but also because of longer-term inflationary pressures which have been driven by supply chain shortages and of course the Covid pandemic. We are seeing a perfect storm in the global economy: rising prices, tightening monetary policy and already high levels of borrowing that restrict the scope for governments to spend their way out of the inevitable slow-down in growth from lower levels of household real incomes.
The price increases evident through trade show that immediately after the Russia-Ukraine conflict started, the raw materials essential to electronic supply chains were the most affected. Clearly, because of the importance of Russia and China in the production of these raw materials, the fighting had an impact. But what the analysis also shows is that the price rises have been longer term and are greater in China. In other words, it’s not possible to conclude that everything stems from one event.
The role that fiscal or monetary policy can have in influencing inflation or preventing a recession is debatable. Foreign policy began to filter through into trade via US tariffs on iron and steel in 2018 as a means of constraining Chinese economic influence. US restrictions on technology businesses working with or in China deepened the use of trade in national strategy and have been followed by sanctions and embargoes against Russia by the EU, the US, the UK and allies restricting global trade. However, the unintended consequence of the use of trade in foreign policy has been to create an inflationary backlash which affects people on the ground all around the world. Combine this with container vessels stuck in the Suez Canal (the March 2021 Ever Given saga), the after-effects of a zero-Covid strategy in China, and a shift towards reducing fossil fuel dependency and the “exogenous” drivers of inflation are clear to see.
Consumers around the world will need support with rising energy prices, but spiralling and unpredictable inflation is malignant, so support needs to be targeted and affordable. Similarly, monetary policymakers must factor in, as they are doing, the fact that global recession is likely if interest rates go too high; as the causes of inflation are outside of the monetary system, there is only so much that can be done.
But perhaps the most important way of moving from where we are now towards a more stable future is to think about how trade policy itself could help. Take the example of Africa, whose nations provide enough fossil fuel and enough cereals to reduce dependency on Ukraine and Russia for these products. By supporting African policymakers and financial institutions to develop the infrastructures supporting intra-regional trade, via co-investments or inward investment, there is scope to reverse the impact of higher prices on the population of Africa.
As I have observed before, trade, in that it has been used strategically in foreign policy, has been weaponised. Inflation is the result and this affects everyone. There are levers that can be pulled through trade to make it a force for de-escalating these pressures and if we don’t use them, the situation could worsen still. Is that really a price worth paying?
Dr Rebecca Harding is an independent trade economist and CEO of Coriolis Technologies
Sources
1 See imf.org
2 See bankofengland.co.uk
3 See "Inflation where next" at flow.db.com
4 See chathamhouse.org
5 See "Why its time for a new look at rare earths" at flow.db.com
6 See "How to ensure commodities security in a volatile world" at corporates.db.com
7 See chathamhouse.org
8 See xinhuanet.com

Dr. Rebecca Harding
Independent trade economist
Trade finance solutions Explore more
Find out more about our Trade finance solutions
solutions
Stay up-to-date with
Sign-up flow newsbites
Choose your preferred banking topics and we will send you updated emails based on your selection
Sign-up Sign-upYou might be interested in
Trade finance and lending, Macro and markets
Why it’s time for a new look at rare earths Why it’s time for a new look at rare earths
Greater diversity of rare earth metals (REM) supply is essential if the world is to address the dominance of producers such as China and Russia, suggests Dr Rebecca Harding
Corporate Bank solutions
How to ensure commodities security in a volatile world How to ensure commodities security in a volatile world
The Russian invasion of Ukraine has put a spotlight on Europe’s uncomfortable dependencies. Securing access to important commodities is key to economic resilience, as well as digital and sustainable transformation – and this requires rethinking sourcing strategies as our new flow special white paper outlines
MACRO & MARKETS, CASH MANAGEMENT
Inflation: where next? Inflation: where next?
As inflation moves upwards, central banks continue to assert that the increase is transitory. Yet a return to “uncomfortable levels” is a very real prospect as the US economy undergoes its biggest shift of direction in four decades and others follow its lead, reports flow’s Graham Buck


