26 May 2022
The majority of world trade is unsustainable, and where it is not, it is a symptom of under-development, says trade economist Rebecca Harding. She shares her methodology for a trade sustainability score and demonstrates why trade policy needs to change
MINUTES min read
What happened to the ambitions of COP26? In December 2021, analysts and commentators alike were talking about 2022 as though it was likely to be the most important year for sustainability since the Paris Climate Accord. Policymakers set ambitious net-zero goals, there were further bans on deforestation and targets to reduce the amount of methane.
Alongside this, regulators in the EU in particular introduced stringent mandatory reporting requirements in the form of the Sustainability Financial Disclosures Regulation1 and the EU taxonomy,2 as well as in the form of the EC’s proposal for a law on corporate sustainability obligations – known as the EU Supply Chain Law expected to be enforced in 2025.3 By 2023 there will be requirements to report on both the “E” (environment) and “S” aspects of ESG (Environment, Social and Governance) criteria. The Security and Exchange Commission has similarly announced its intention to make mandatory sustainability reporting.4
The crisis in Ukraine initially diverted attention away from this focus on sustainability. However, the EU’s reliance on Russia for oil and gas in particular has put a spotlight on the need to source energy from alternative suppliers as well as from alternative means.5 Financial transactions with Russia are now affecting the types of goods traded as well as individuals and entities.6 As a result of all this, the “G” in ESG has increased in importance as well.
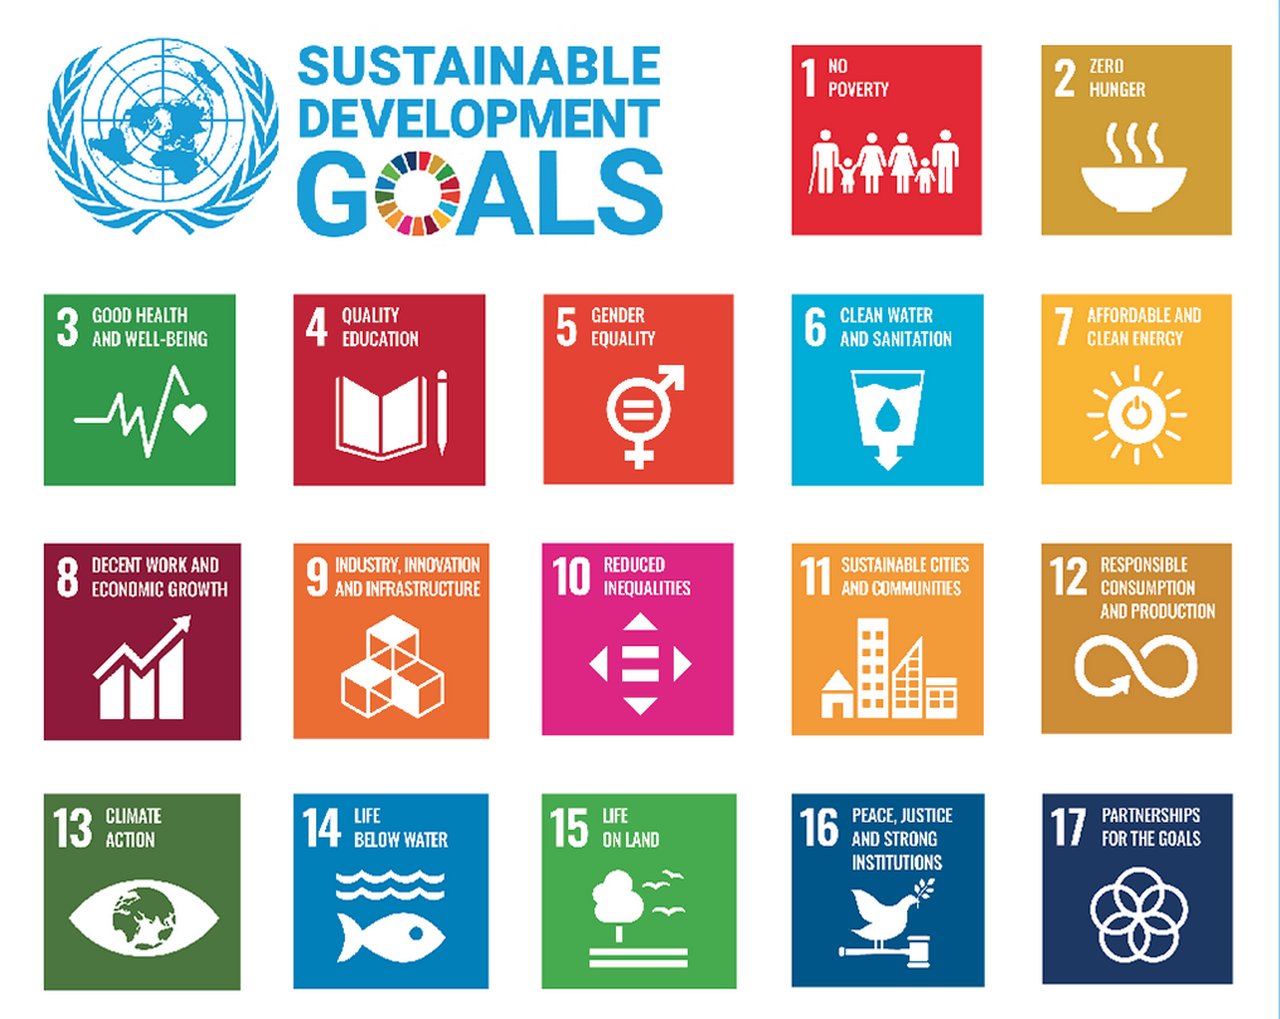
Yet the “how” of all of this remains vague. The International Chamber of Commerce’s joint position paper on measuring sustainable trade7 puts forward a proposal to use the Sustainable Development Goals (SDGs) as a framework for the approach to financial reporting. This is a useful framework, yet there is little guidance on exactly what needs to be measured, how it aligns with the SDGs and, most importantly of all, the base unit of measurement. It looks first at the challenges of measurement, and then looks at how to measure trade flows between countries, both within the EU and between the EU and the rest of the world, in a consistent way, using the match of product Harmonized System (HS) codes (those used in international customs and excise records as a means of allocating tariffs and duties), to the well-known SDGs as illustrated in the 17 SDG icons (see Figure 1).

Figure 1: The 17 SDG icons
Source: United Nations
Measuring ESG in practice
All countries have one thing in common – they trade in goods.8 So if it is possible to match the product or service to these SDGs, then a picture of the sustainability of a country through its profile of international trade can be drawn. The concept of the SDG is important because the regulations that are being developed are all based on these in one form or another – it is an agreed, standardised starting point, since both the definition of a product and of the SDGs are already agreed.
The approach taken here is developed from the United Nations ESCAP matching of SDGs to the HS codes first published in 20199 and the subsequently released “R” code that provides a schema for matching SDGs to Non Tariff Measures (NTMs).10 The research conducted by the UN ESCAP both highlights the materiality of trade to the broader sustainability agenda, but similarly provides an excellent baseline for improving the matching. In particular, Coriolis Technologies has taken this paper and added to the number of products, as represented by their HS code, by undertaking an analysis for each product not covered in the paper, and using a global discourse analysis of how these products are reported in relation to the key words contained in the SDGs positively or negatively.
In other words, the data looks at products only and uses the country’s product-based profile of trade using refined United Nations Comtrade data11 at a six digit HS code level.12 It matches the country’s imports and exports to the 17 SDGs13 in terms of their negative or positive contribution. The approach then weights them for the value of trade in each SDG from the trade profile of the country concerned.
Because some products count against several SDGs, the total annual values are higher than the value of trade in a country. For simplicity of comparison, the score is normalised on a ranking of -1 (where everything is negative) to +1 where everything is positive. A score of 0 means that trade is neither negative nor positive.
So how sustainable is world trade?
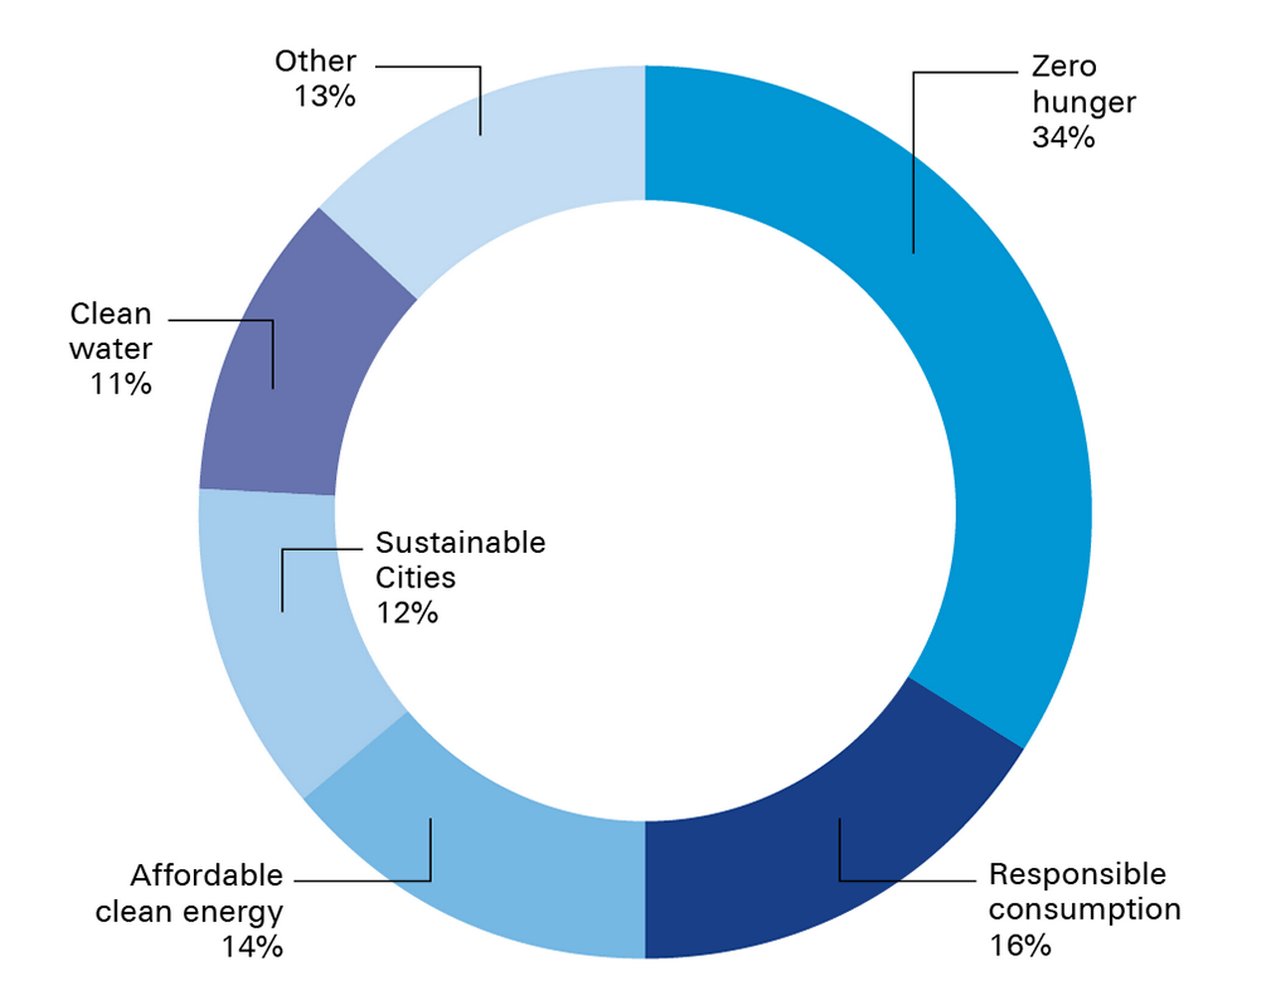
The analysis concludes that world trade is negatively contributing to the SDGs. Overall, the score for trade across the world is -0.58. Nearly 80% of world trade contributes negatively to SDGs. In other words, in 2020 the negative impact was some US$122.7tn that undermined the achievement of SDGs. The equivalent value of positive contributions was just US$19.3tn, or 17%. The top five negative contributions to SDGs in value terms are summarised in Figure 2.

Figure 2: Percentage of total negative value contributed by global trade by largest negative contributions
Source: Coriolis Technologies
If these figures were not worrying enough in their own right, the trade profiles of developed economies with heavy manufacturing bases are generally less sustainable than emerging economies. For example, intra-EU trade scored -0.68 in 2020, while imports into the EU as a whole scored 0.67, and exports -0.71.
This can be explained by a simple look at the EU’s trade profile. The top five sectors that the bloc of 27 EU countries imports from and exports to the rest of the world are oil and gas, electricity, machinery, automotives and pharmaceuticals. As a result, adding these together, some US$4.7tn of trade in 2020 contributed negatively towards the elimination of hunger, US$2.2tn of trade contributed negatively towards responsible consumption and production, and a further US$1.6tn made negative contributions towards affordable and clean energy. In contrast, only US$2.3tn contributed positively towards decent work and only US$257.5bn went towards good health and wellbeing, even in a year where health was a primary public policy concern.
Intra-European trade has a similar profile – all of which reflects the fact that the EU’s regional supply chains that fuel its exports to the rest of the world are equally unsustainable. Some of the eastern European nations within the EU score worst – in 2020, Hungary’s exports to the rest of the EU were at -0.75 on the ranking of -1 to +1, for example. The reason was the country’s heavy reliance on imports and exports of plastic components to automotive and electronic supply chains. Romania and Slovakia have similar trade profiles in terms of ESG. While all improved during 2020 compared to an average score since 2011, this was largely due to an overall drop in trade in automotives and oil and gas, rather than an intrinsic improvement in the sustainability of trade.
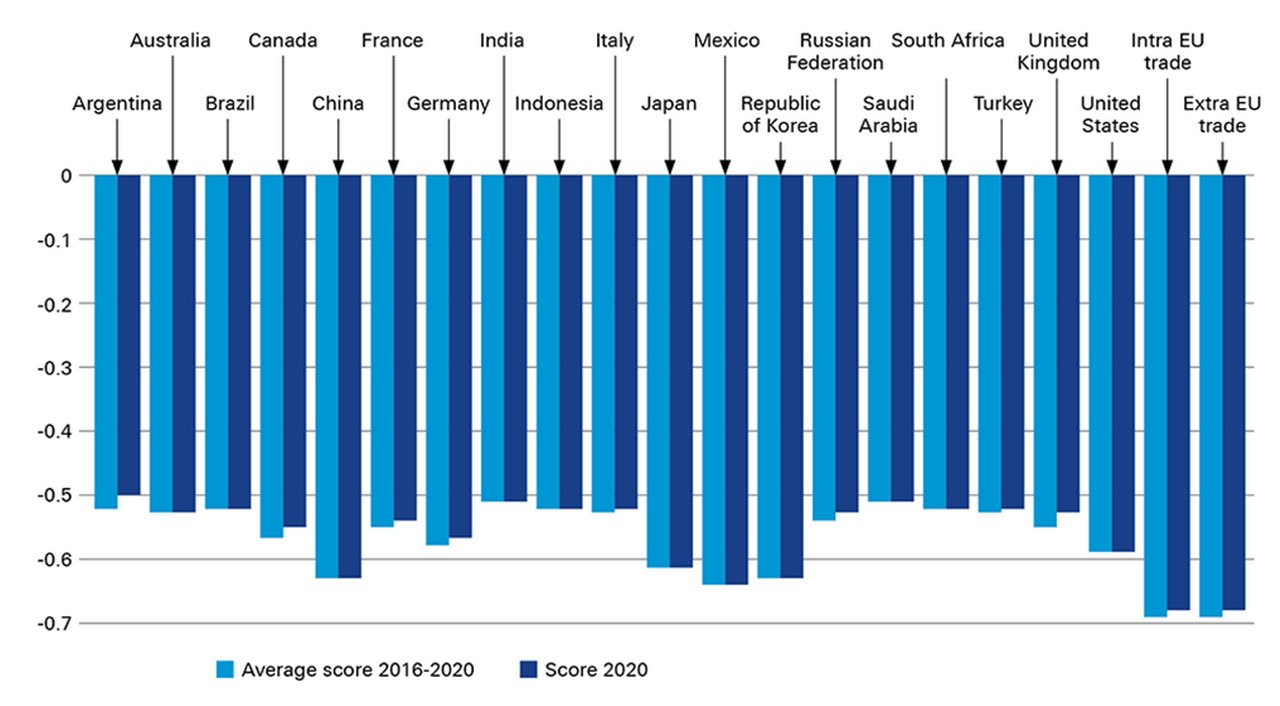
Two aspects of this scoring system are really interesting however, and both are positive. The first is that, for many countries, 2020 was better in terms of sustainability than an average for the past five years. This is unsurprising, since 2020 was the year when pandemic-induced reductions in global trade meant that for a few months the amount of fossil fuels, manufactured items and consumer goods was considerably lower (see Figure 3).

Figure 3: G20 trade sustainability scores, 2016-2020 and 2020 compared
Source: Coriolis Technologies
By way of example, Germany’s global trade improved from -0.58 to -0.57, for example, and while this may not seem a huge improvement, it was caused by nearly 14% annualised growth in vaccines to the end of 2020, a result of the Covid 19 pandemic.
The largest and most manufacturing-heavy economies fare the worst of the G20 in terms of the sustainability of their trade: The EU’s trade, whether within the region itself or between the region and the rest of the world, has the lowest score, but China, South Korea, Japan and Mexico also tip above the -0.6 mark. These are economies where automotives, consumer electronics as well as machinery and components (including computing) are routinely among the top five sectors for both imports and exports. Interestingly, the UK has one of the better scores for the developed economies, but this reflects a smaller manufacturing base and a higher contribution of sectors such as “Works of Art” – its tenth largest sector for exports – which are not measured against SDGs.
The other positive aspect of this scoring system is that it does not bias the sustainability risk against emerging economies, or oil producing economies. Within the G20 it is the emerging economies, with the exception of China and Mexico, that have the best scores, albeit still negative. Within the G20, the oil producing economies are the ones that have among the better scores – not because exporting fossil fuel is necessarily a good thing, but because they are less reliant on imports for their own energy requirements.
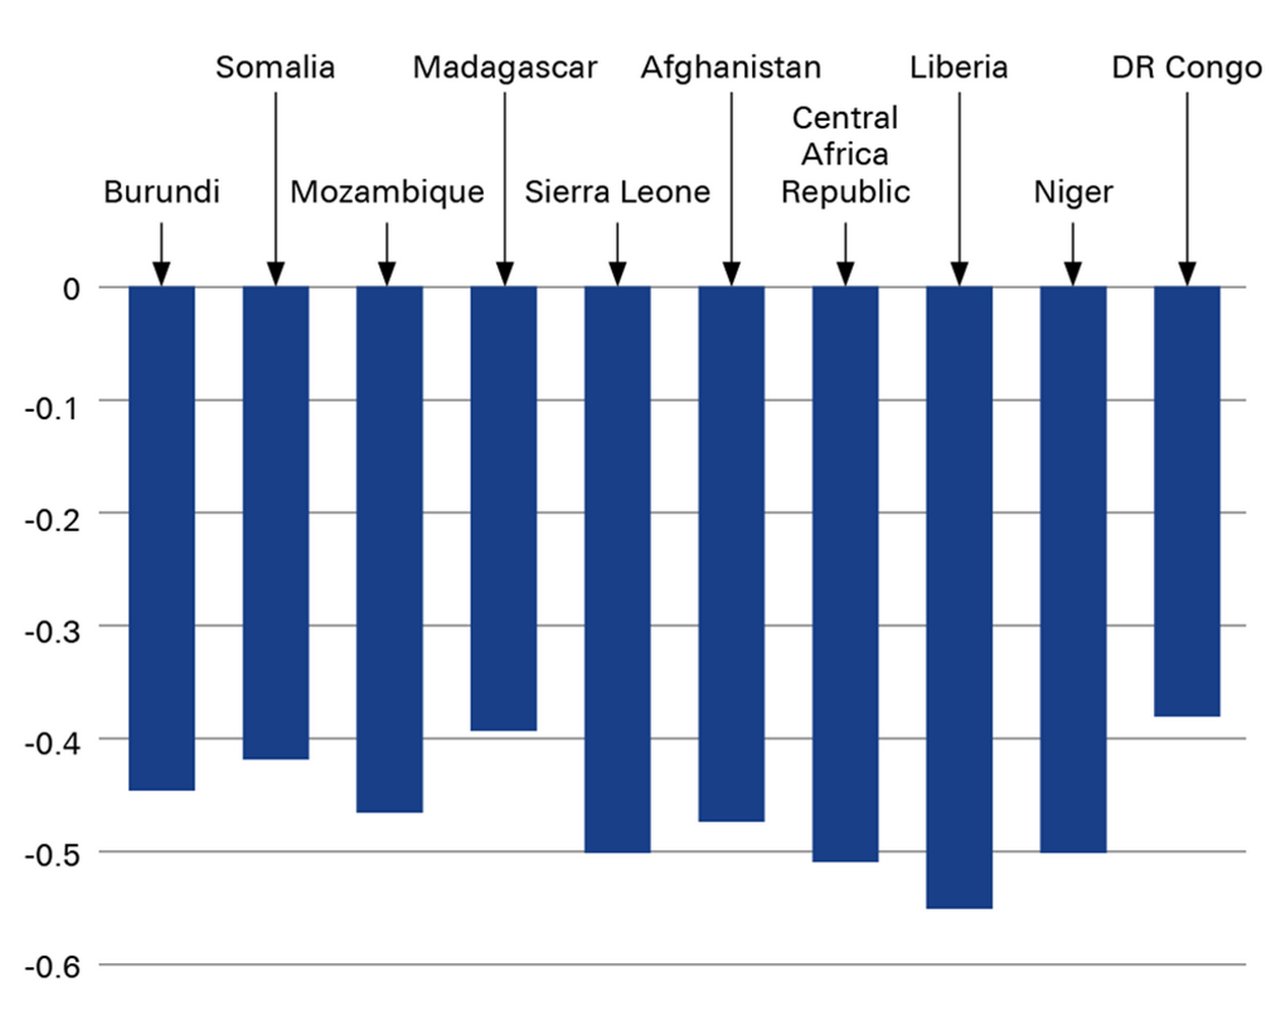
For the poorest nations in the world, the scores are materially lower – between -0.39 and -0.52 (Figure 4)

Figure 4: 2020 trade sustainability score
Source: Coriolis Technologies
Figure 4 highlights the fact that trade in the poorest economies has a completely different structure to trade in developed world economies. For example, Madagascar’s cereal imports were some US$206m in 2020, while automotive imports were similar at just US$214m and on a steady downward path since 2017. In other words, imports are often for subsistence purposes rather than aimed at meeting luxury or consumption-based markets.
Under these circumstances a “better” ranking, insofar as it reflects lower economic development, is not a necessarily a good thing. But what it does mean is that the SDG-related risks of trade are lower and that such countries should not be excluded from trade deals or trade finance on the grounds of sustainability since, comparing like with like, their trade is less environmentally damaging.
Implications for trade policy
This scoring system is a wakeup call for world trade and policy makers all around the world. Some of the most advanced economies have the least sustainable trade, the value of which is estimated at around US$18.5tn negative contributions, that eat into trade from responsible consumption and production (SDG 12). If we are to meet the ambitious targets laid out at COP26, we cannot afford to ignore the messages here – that the majority of world trade is unsustainable, and where it is not, it is often a symptom of under-development.
There is work to be done on this type of metric. For example, breaking down each SDG into its “E”, “S” and “G” contribution in trade terms is the next iteration of this model. Early indications suggest that it will reduce the scores further rather than improve them. Country scores also need to reflect the regulatory context of each country and the extent to which the tariff and non-tariff systems reflect sustainability objectives. This however, will bias the results back in favour of those countries with better regulatory regimes, so what has been presented here represents a neutral model based on the trade profile and patterns of any given country.
It's other advantage lies in its potential policy application. First, since we know the SDGs where the largest negative contributions are likely to be across world trade, we know the levers we should pull. Too much of world trade contributes negatively either to zero hunger (in other words it potentially makes access to food worse), or to negative climate conditions such as affordable and clean energy, clean water and sustainable cities.
Second, we also know the sectors which are to blame for the low scores of some countries: automotives, consumer electronics, machinery and components, plastics, iron and steel, and oil and gas. Oil and gas alone contributes some 10% to the value of world trade so if we can reduce our dependency on it, we can also reduce the negative contributions to SDGs that trade makes. Similarly, the countries that have the worst scores all have automotives in their top five imports and/or exports. If policy incentives towards the use of electric cars and clean energy can be implemented then this may address some of the negative role that automotive and fossil fuel trade play at present.
These are age-old challenges, and addressing them will be neither quick nor easy. However, if we know how to measure them, we can also measure progress towards addressing them. This feels like progress.
Dr Rebecca Harding is an independent trade economist and CEO of Coriolis Technologies
Sources
1 See https://bit.ly/39ieR6e at ec.europa.eu
2 See https://bit.ly/3MfxshR at eur-lex.europa.eu and https://bit.ly/3wbkigk at eur-lex.europa.eu
3 See https://bit.ly/3Ni7KcV at flow.com
4 See https://bit.ly/39YZXCl at sec.gov
5 See https://bit.ly/3sAqHPT at flow.com
6 See https://bbc.in/3wbqo0j at bbc.co.uk and https://bit.ly/3FPGwYr at gtreview.com
7 See https://bit.ly/3yFpE5h at iccwbo.org
8 Note, countries trade in services as well, but this first piece of work covers goods only.
9 See https://bit.ly/37QBdeS at unescap.org
10 See https://bit.ly/3sD6ngS at r.tiid.org
11 This refinement is a bilateral mirroring by product and country trade flow (imports and exports) to plug gaps in the trade data for under-reporting nations or sectors. The average of two flows is taken and weighted in favour of the most “trustworthy” dataset. Trustworthiness is derived from reporting regularity and consistency over time.
12 See https://bit.ly/39mzQoy at trade.gov
13 See https://bit.ly/3a4uizt at unescap.org

Dr. Rebecca Harding
Independent trade economist
Trade finance solutions Explore more
Find out more about our Trade finance solutions
solutions
Stay up-to-date with
Sign-up flow newsbites
Choose your preferred banking topics and we will send you updated emails based on your selection
Sign-up Sign-upYou might be interested in
TRADE FINANCE, SUSTAINABLE FINANCE
Farewell to hydrocarbons Farewell to hydrocarbons
The Ukraine crisis has highlighted Europe’s dependence on Russia for gas while diverting attention from the wider issue of delivering on COP26 net zero pledges. Trade economist Rebecca Harding analyses the trade flows and explains how clean energy supply chains are also highly interconnected
Sustainable finance, Trade finance and lending
EU tightens the ESG reins in supply chains EU tightens the ESG reins in supply chains
The European Commission has proposed a new regulation to foster sustainability in corporate supply chains. If enacted, companies will be required to ensure that human rights are respected, and environmental impacts are reduced in their own operations and value chains. flow’s Desirée Buchholz examines what this means in practice
TRADE FINANCE, SUSTAINABLE FINANCE
Powering electric vehicles – the commodities impact Powering electric vehicles – the commodities impact
Electric vehicle sales are rising, and progress is underway in finding alternatives to fossil fuel-based vehicle propulsion. What does the transition to EVs mean for the minerals and metals used to reduce emissions, manufacture car batteries and develop fuel cell solutions? Clarissa Dann reports


